Using the Chrome DevTools new code coverage feature
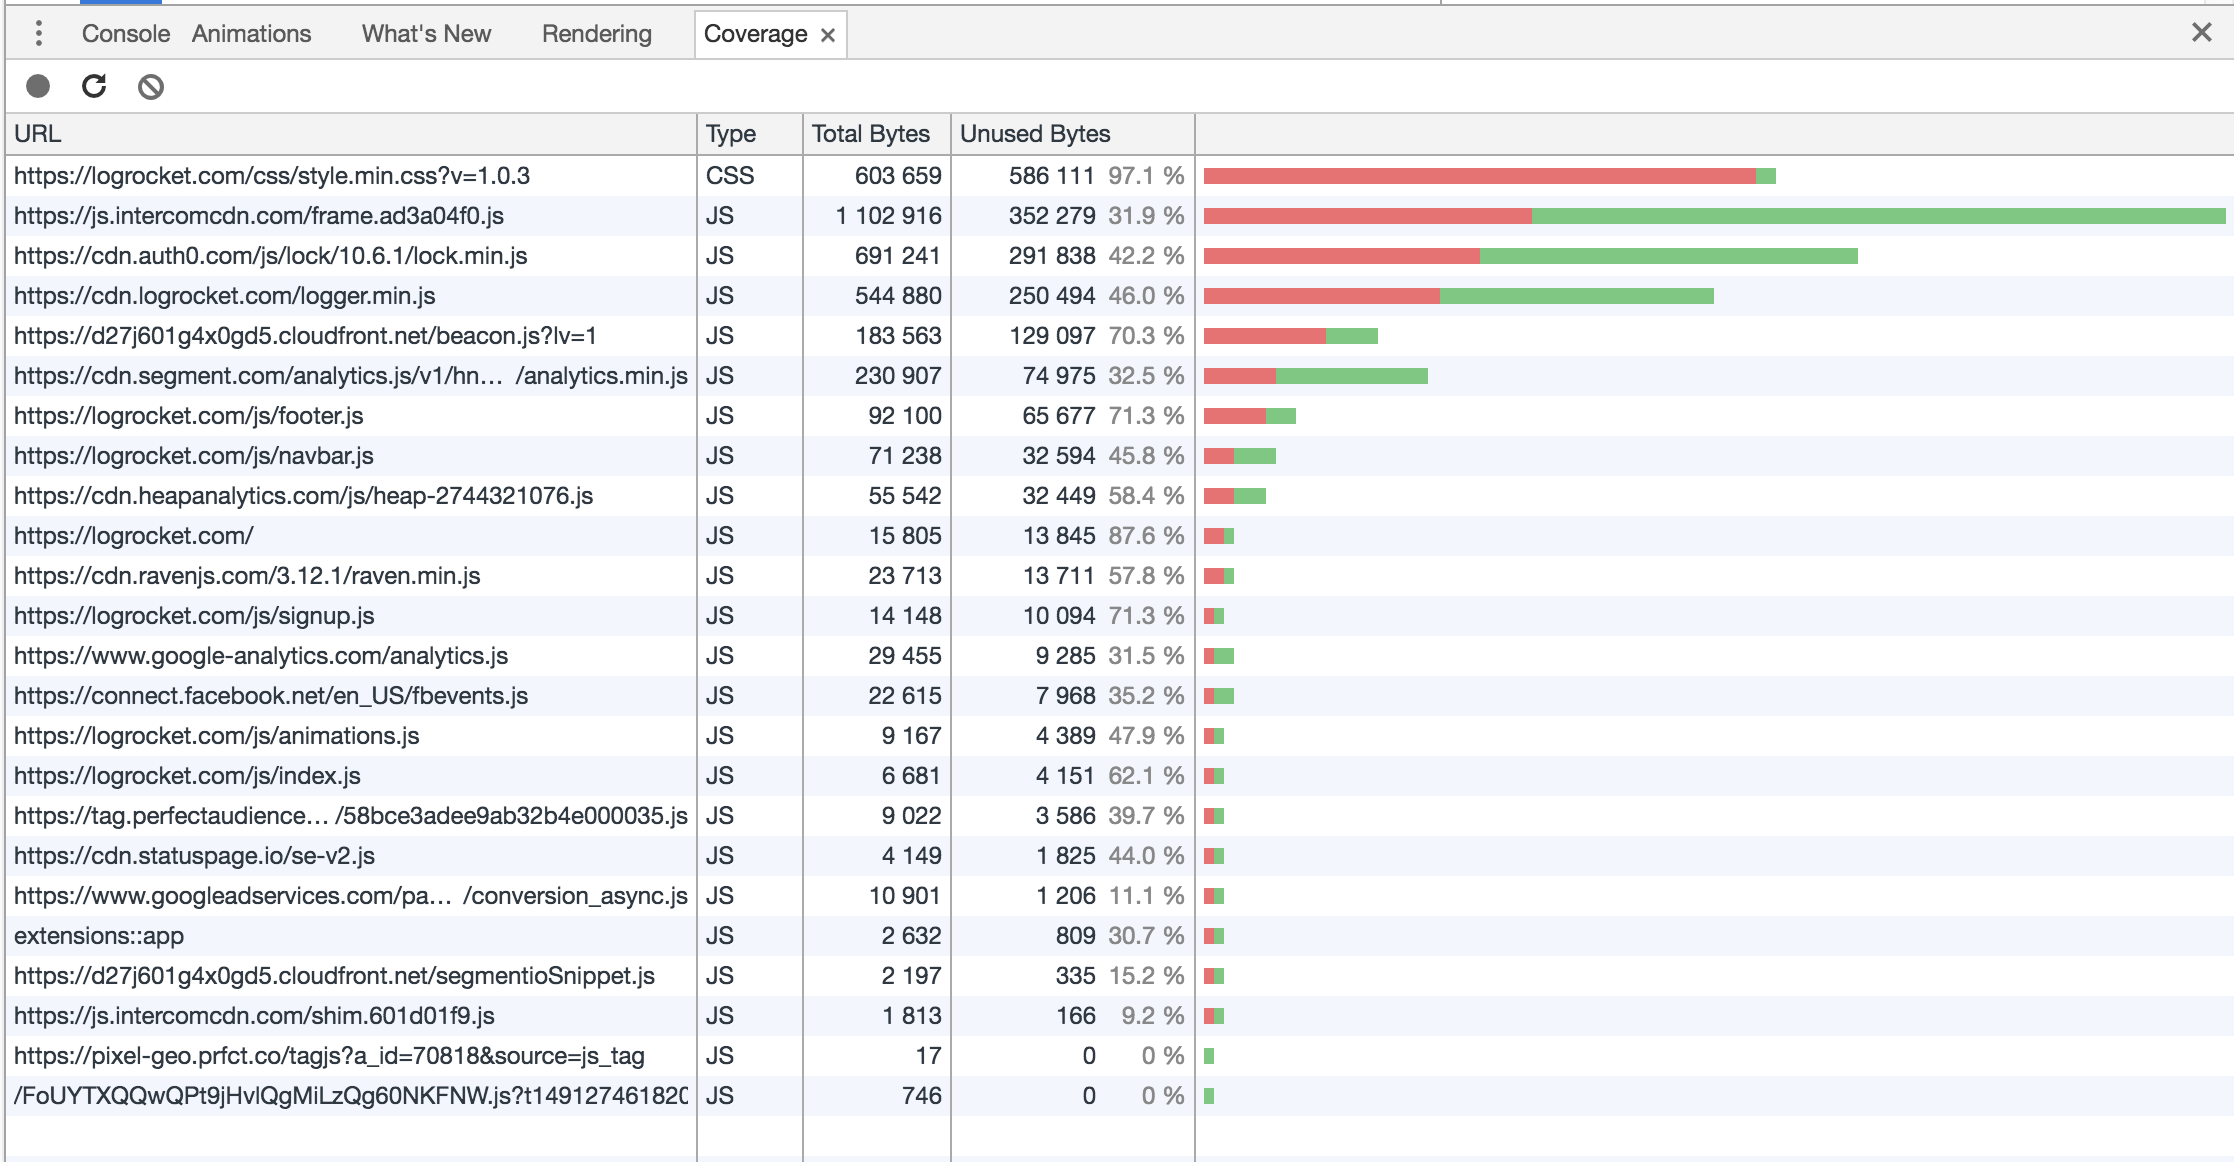
While the name is a bit confusing, this new tool helps you compare the volume of code you’ve authored to the the amount of code that is actually executed by the browser. It’s a cool idea, but you should take it’s results with a grain of salt: This tool is only diagnosing your project based on the current page and/or flow (if it’s a single page app). Be careful not to take the results as gospel and start eliminating code without knowing whether it’s actually unused in all scenarios.
Now… tie this into an automated testing tool and gather results from a complete run-through of an app or site and you’ve got something you can actually use to improve your site’s performance.
It’s worth noting that there are static analysis tools for many task runners that can actually run queries against your HTML templates and remove unused styles automatically. I’ve used gulp-uncss on a few projects and found it to work reasonably well (though you have to tune it for any JavaScript-related styles since it only consults your HTML to find matches).